Understand Viewer Analytics
How Do I Track Who Viewed My Document?
PaperLink tracks how viewers interact with your shared documents. You can see who viewed, which pages they read, how long they spent, and whether they downloaded the file.
Where to Find Analytics
Analytics are available at two levels:
File-level analytics. Open a document from Shared Documents in the sidebar. The analytics panel shows combined data across all sharing links for that document.
Link-level analytics. Open a document, then click on a specific sharing link. This shows analytics for that link only - useful when the same document has multiple links for different audiences.
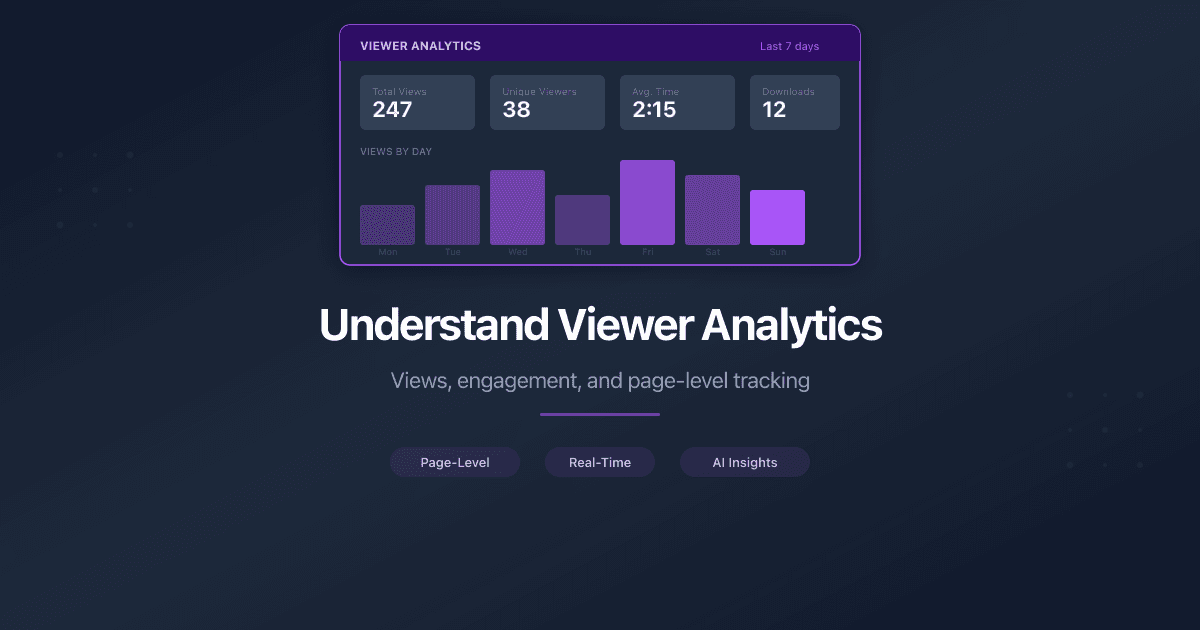
Summary Metrics
The top of the analytics panel shows four summary cards:
Views - the total number of times the document was opened through this link (or all links, at file level). Each time a viewer opens the link counts as one view. The same person opening the link three times creates three views.
Unique Visitors - the number of distinct people who viewed the document. PaperLink deduplicates by email address (if captured), user account (if logged in), or hashed IP address. Three views from the same person count as one unique visitor.
Average Duration - the average time viewers spent with the document open, shown in minutes and seconds (e.g., "2m 30s"). Only sessions with recorded duration are included.
Downloads - the total number of times viewers downloaded the file. This metric only appears if the link has downloads enabled.
Viewer Details
Below the summary cards, the analytics panel lists individual view sessions. Each entry shows:
| Field | What it means |
|---|---|
| The viewer's email address (shown if the link requires email verification or login) | |
| Country | Where the viewer accessed from, detected by IP geolocation |
| Device | Desktop, mobile, or tablet |
| Duration | Total time the document was open in that session |
| Pages | Number of pages viewed out of total (e.g., "3 of 10") |
| Downloaded | Whether the viewer saved the file during this session |
| Date | When the view occurred |
If the link does not require email verification, the viewer appears with their country and device information only. Enable email verification on the link to see who each viewer is.
Page Engagement
The page engagement section shows how viewers interact with individual pages:
- Time per page - how long viewers spend on each page, averaged across all sessions
- View count per page - how many viewers reached each page
- Heatmap - a visual indicator of which pages get the most engagement
A page with high time and high view count is engaging. A page with low view count means most viewers did not scroll that far - it may be too deep in the document, or earlier pages caused the viewer to leave.
If a page has high time spent but only a few viewers reached it, the content on that page is engaging for those who find it. Consider moving it earlier in the document.
Interpreting the Data
"Viewed 3 of 10 pages" means the viewer opened 3 unique pages during their session. They may have scrolled through the first 3 pages, or jumped between specific pages (e.g., pages 1, 5, and 8).
Completion rate is the percentage of pages viewed out of total pages. A viewer who read 3 of 10 pages has a 30% completion rate. The average completion rate across all viewers appears in the summary.
Duration vs. pages viewed - a short duration with many pages viewed means the viewer skimmed. A long duration with few pages viewed means they read those pages carefully.
Multiple sessions from the same viewer - if the same person returns to the document, PaperLink creates a new view session. The unique visitors count stays at one, but the views count increases.
Folder Analytics
When you share a folder (data room), PaperLink aggregates analytics across all documents inside it:
- Total views and unique visitors across all files in the folder
- Per-document breakdown - each file listed with its own views, visitors, duration, and downloads
- Child folder stats - nested folders show their own aggregated metrics
Related
- Get AI Insight - let AI analyze your sharing data and generate actionable recommendations
- Create a Sharing Link - set up links with access controls that feed into analytics
- Track Who Viewed Your Shared Documents - detailed guide on all analytics capabilities
- Require Email Before Viewing Shared Documents - enable email verification to identify viewers by name
War dieser Artikel hilfreich?
Brauchen Sie mehr Hilfe?
Durchsuchen Sie unser Hilfezentrum oder kontaktieren Sie unser Team für persönliche Unterstützung.
Verwandte Artikel
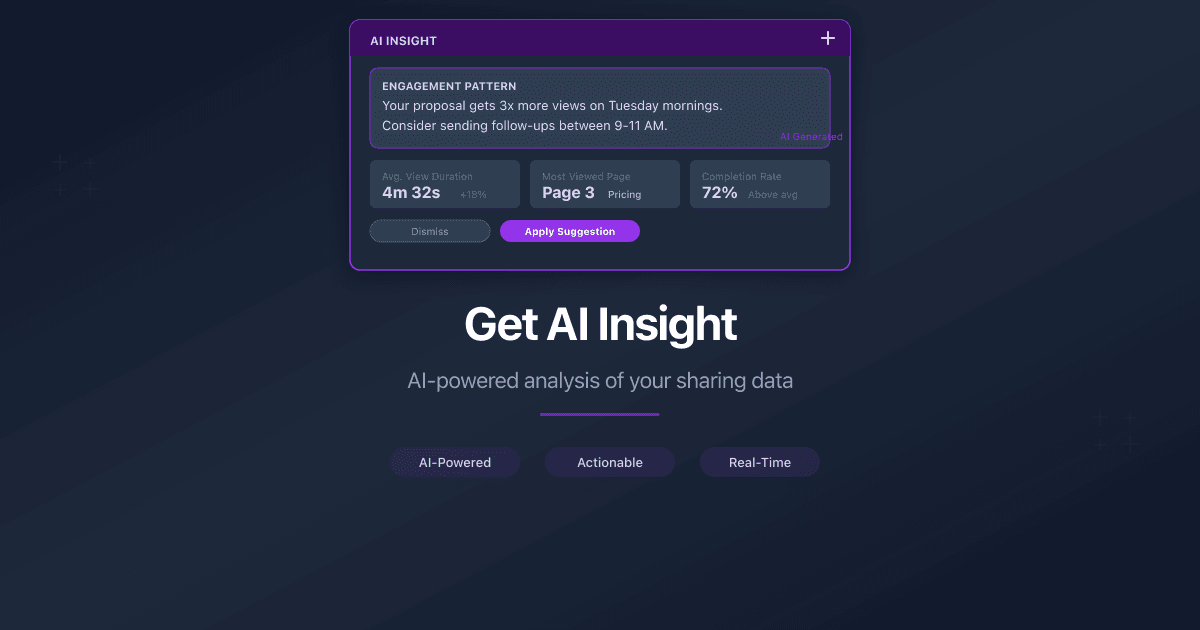
Get AI Insight for Shared Documents
Use AI Insight to analyze your document and folder sharing data. PaperLink's AI reads viewer engagement patterns and generates actionable recommendations.
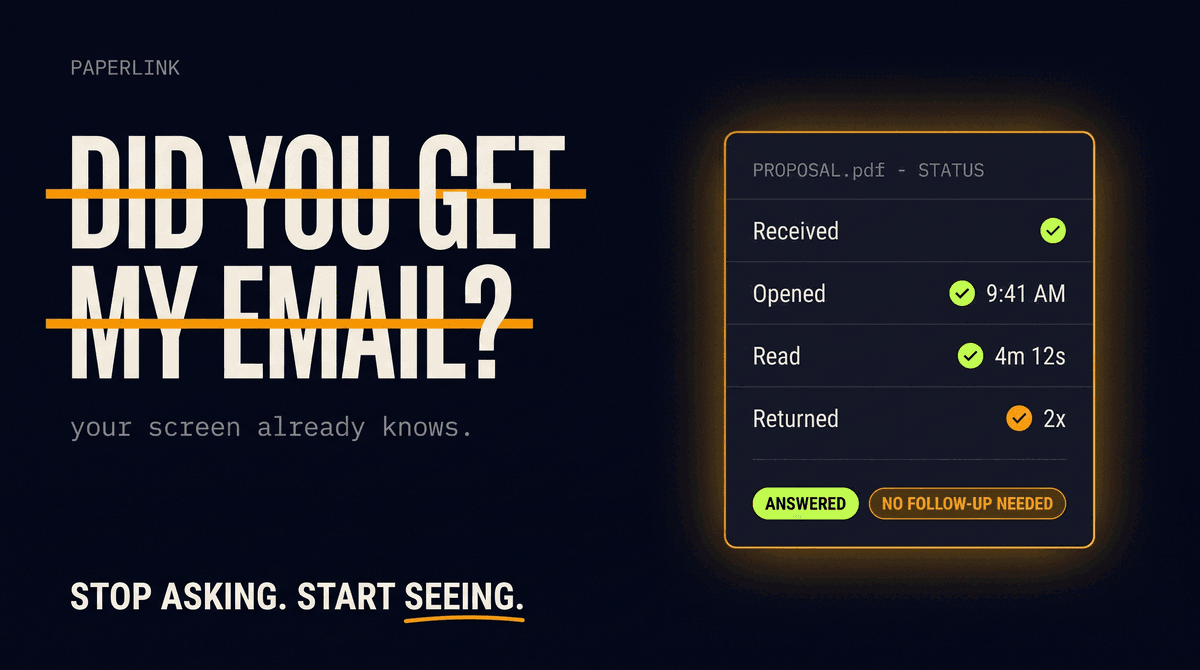
The End of "Did You Get My Email?"
Asking whether someone received your document is a relic of working blind. As shared documents carry their own analytics, that question is quietly disappearing from business.
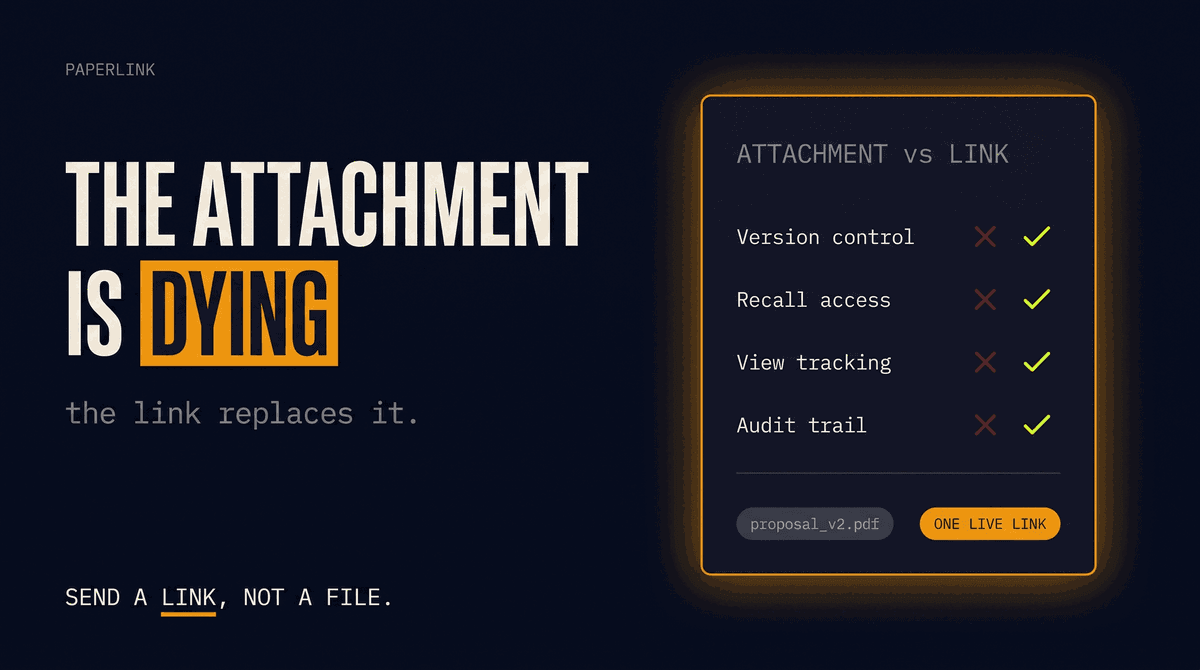
Why Email Attachments Are Dying in B2B Sales
The PDF attachment is a broken format for B2B sales: no access control, no version control, no recall. Why sales teams are replacing attachments with tracked links.
7 Digify Alternatives for Document Sharing in 2026
The best Digify alternatives for document sharing and data rooms in 2026. Honest comparison across security, pricing, analytics, and eSignature features.