You sent your pitch deck to 40 investors on Monday. By Friday, three have replied. The other 37 are silent. You do not know if they opened the PDF, forwarded it to a partner, or deleted the email without reading it.
This is the fundraising silence problem. Founders spend weeks building a pitch deck, carefully selecting investors, and crafting personalized outreach - then lose all visibility the moment they click send. The follow-up decision becomes a guess: too early seems desperate, too late seems disinterested, and without knowing whether the investor even opened the deck, every timing choice is uninformed.
Document analytics solve this by showing exactly who opened your deck, when, for how long, and which slides held their attention. The data does not guarantee a meeting. But it transforms follow-up from blind outreach into informed conversation.
What Pitch Deck Analytics Reveal
When you share a pitch deck through a platform with page-level analytics instead of a raw email attachment, you see the investor's interaction in detail:
Who opened it. If you require email verification or use personalized links, you know which specific investor - or which associate at their fund - viewed the deck.
When they opened it. A timestamp shows whether the investor viewed your deck the day you sent it or three weeks later. Timing patterns reveal priority: same-day opens suggest interest. Week-later opens suggest they are working through a backlog.
How long they spent. The average investor spends about 3 minutes and 44 seconds on a pitch deck. An investor who spends 8 minutes is evaluating seriously. One who spends 30 seconds probably clicked through without reading.
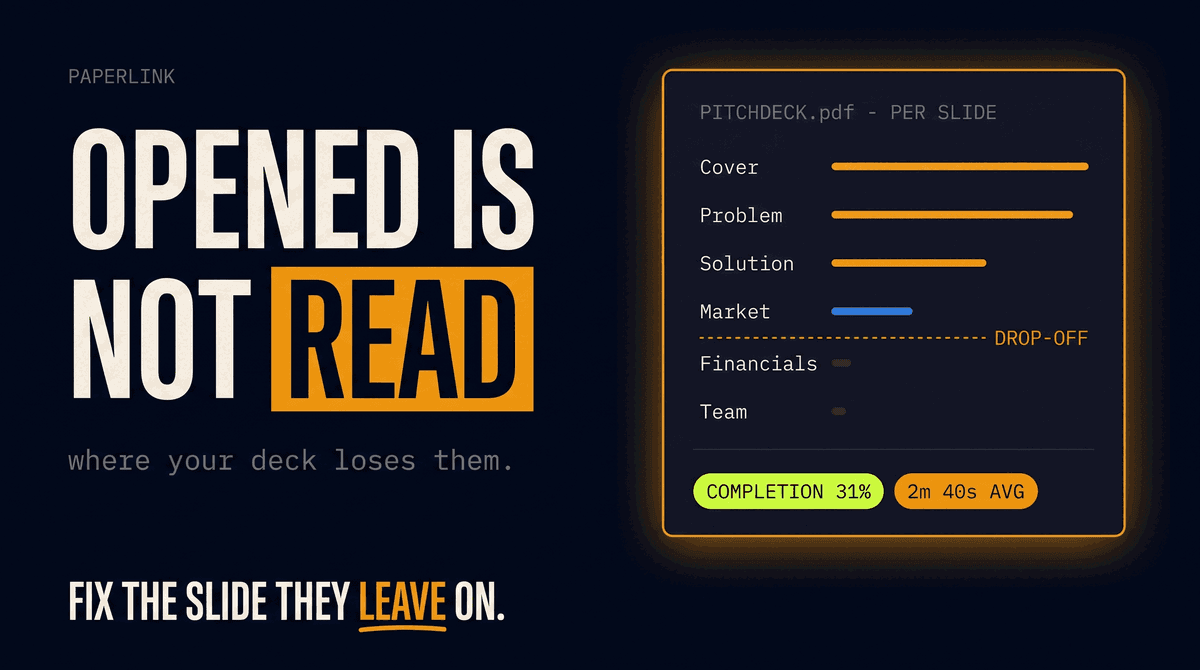
Which slides held attention. Page-level time tracking shows where the investor lingered. Two minutes on the financial projections slide and 10 seconds on the team slide tells a different story than the reverse. This data reveals what matters to that specific investor - and what your follow-up email should address.
Whether they returned. An investor who opens your deck three times and shares it internally is more interested than one who never opened it. Return visits - especially to specific slides - are one of the strongest signals of genuine interest.
Whether they forwarded it. If you see new viewers from the same fund opening your deck, the original recipient shared it with colleagues. This is typically a positive signal: the deck is circulating within the investment committee.
Page-level analytics distinguish between an investor who read your entire deck and one who viewed only the first three slides before closing. Both show as "opened" in email tracking. Only page-level data reveals the difference - and the follow-up strategy for each is different.
How Analytics Change Your Follow-Up Strategy
Raw investor outreach is a numbers game. Analytics-informed outreach is a signal game. The data turns each follow-up from a cold email into a conversation based on what the investor already showed interest in.
The Signal Framework
| Analytics Signal | What It Means | Follow-Up Action |
|---|---|---|
| Opened, 5+ minutes, viewed all slides | Genuine interest, evaluated thoroughly | Follow up within 24 hours with a specific question, not a generic check-in |
| Opened, 2-5 minutes, focused on financials | Evaluating unit economics | Follow up referencing traction metrics or financial detail not in the deck |
| Opened, under 2 minutes | Skimmed or dismissed | Low priority - consider a different angle or wait for a warm introduction |
| Not opened after 7 days | Did not see it or not interested | Re-send with a shorter subject line, or move to next round of outreach |
| Opened multiple times | Discussing internally | High priority - suggest a call to answer questions they are clearly forming |
| New viewers from same fund | Forwarded to colleagues | Very high priority - the fund is doing internal diligence before reaching out |
| Opened, spent time on team slide | Evaluating founder-market fit | Follow up with team-relevant context: prior exits, domain experience, advisors |
The difference between "Hi, just following up on my pitch deck" and "Hi, I noticed you spent time on our unit economics - here's our latest cohort data" is the difference between a founder who guesses and one who knows.
When Not to Follow Up
Analytics also reveal when to stop. An investor who opened the deck, spent 15 seconds, and never returned has made a decision. Sending three follow-up emails will not change it. Redirecting that energy to investors whose analytics show genuine engagement is a better use of time.
Which Slides Investors Focus On
Pitch deck analytics across thousands of fundraising rounds reveal consistent patterns in where investors spend their time. Understanding these patterns helps founders prioritize both deck design and follow-up content.
Financial projections and traction. Funding expectations and market potential attract the most attention from investors when evaluating startups. Slides with revenue numbers, growth rates, and unit economics consistently receive the most viewing time.
Market size. The TAM/SAM/SOM slide receives disproportionate attention when the investor is evaluating whether the opportunity is large enough for their fund size. Long viewing time here often precedes questions about market positioning.
Business model. How the company makes money. Investors evaluate whether the revenue model is proven, scalable, and defensible. Time spent here correlates with interest in the commercial viability of the product.
Competition. Investors want to understand the competitive landscape. Short time on this slide may indicate they already know the market - or that the competitive analysis is not detailed enough.
Team. Typically viewed later in the evaluation process. Extended time on the team slide after viewing financials often indicates the investor is moving from "is this a good market?" to "are these the right people?"
If analytics consistently show investors dropping off at the same slide, that slide has a problem. Low engagement on slide 7 of a 12-slide deck means half your investors never see your ask. Redesign the drop-off point - or move the strongest content earlier.
Deck Design Informed by Data
Analytics do not replace good storytelling. But they reveal whether the story is landing. Founders who iterate based on viewing data build stronger decks over time.
Optimal length. Data suggests 12 slides is the sweet spot for fully-viewed decks. Decks longer than 15 slides see significant drop-off in completion rates. Every additional slide competes with the investor's attention span - and at 3 minutes 44 seconds average viewing time, each slide gets roughly 18 seconds.
Data density matters. Pitch decks with 30% or more data-related slides attracted investor engagement 3 times longer than text-heavy decks. Numbers are faster to evaluate than paragraphs. Investors skim text but study charts.
Front-load the hook. If analytics show most investors drop off after slide 5, your first five slides must contain the problem, the solution, and enough traction data to justify continued reading. The detailed appendix can follow - but only after the investor is hooked.
From Pitch Deck to Data Room
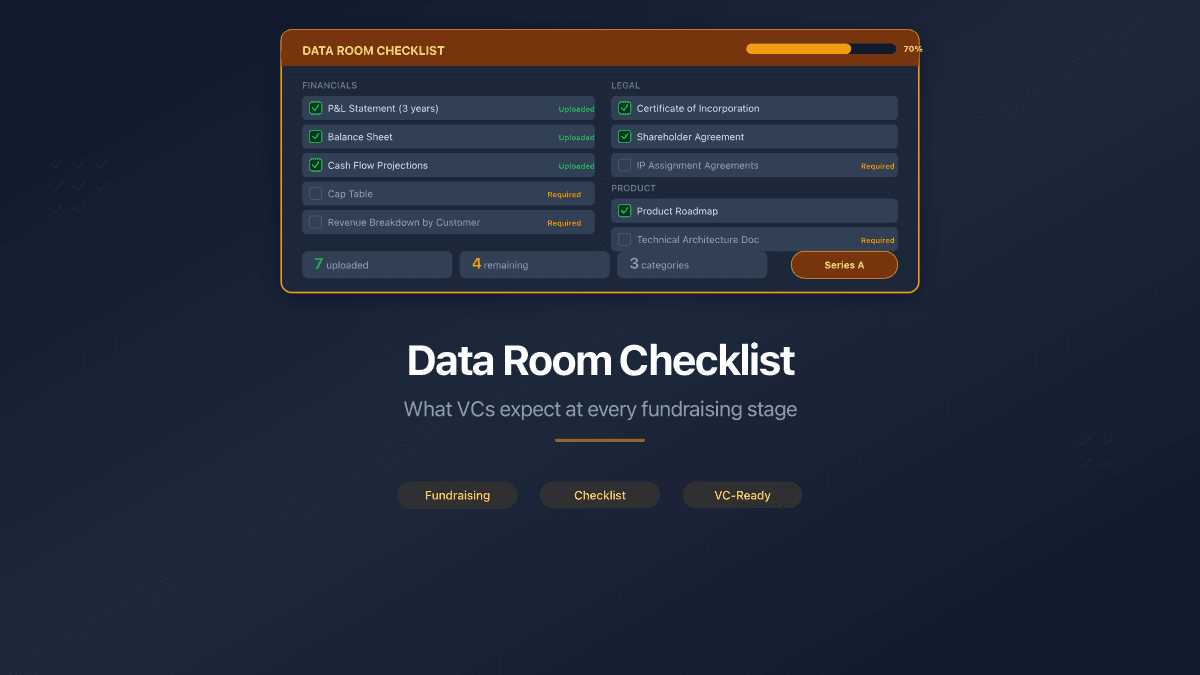
When an investor moves from "interested" to "evaluating," the pitch deck is no longer sufficient. Due diligence requires detailed financials, cap tables, customer contracts, legal documents, and technical architecture. This is where the data room takes over.
The analytics principles apply at the data room stage too, with higher stakes:
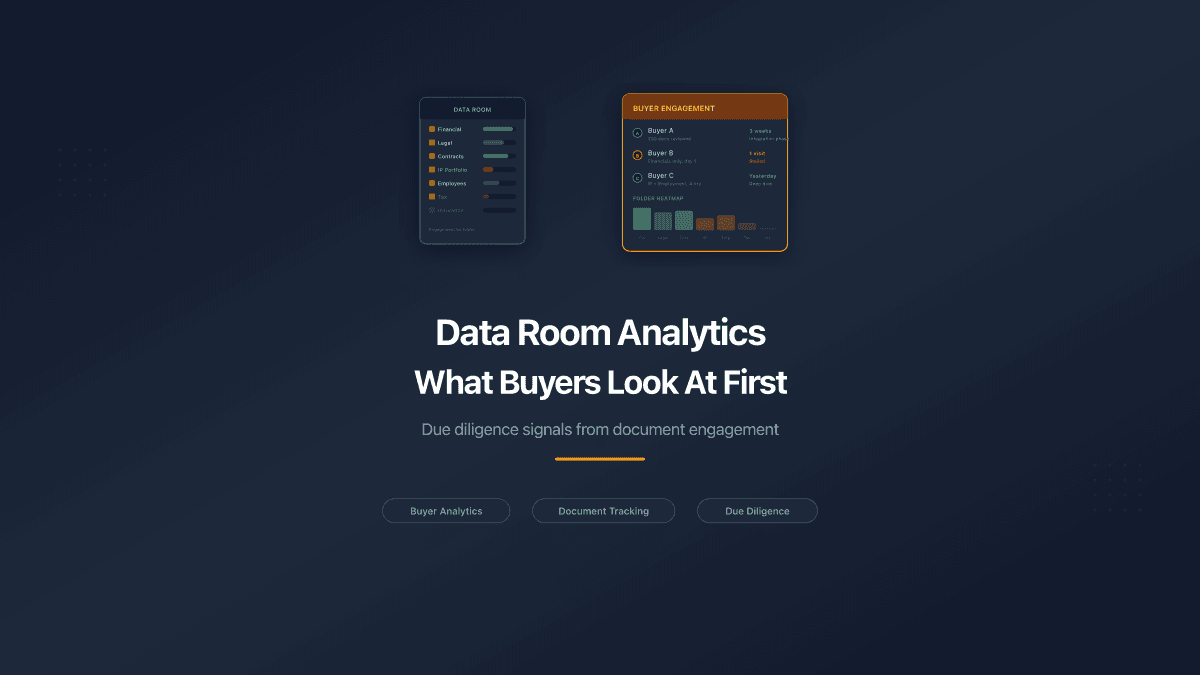
Which documents are being reviewed. If the investor's legal team is reviewing your employment agreements and IP assignments, they are deep in diligence. If they have only viewed the financial summary, they are still in the evaluation phase.
How thoroughly documents are reviewed. Document tracking in data rooms shows exactly which buyers, advisors, and legal teams reviewed materials, how long they spent, and what they revisited. A cap table opened for 30 seconds is a scan. One opened for 15 minutes across two sessions is being analyzed in detail.
What they have not reviewed. Equally important: which data room documents have not been opened. If the investor claims to have completed diligence but the analytics show they never opened the customer contracts folder, you know the diligence is incomplete.
Multiple parties accessing. During a competitive round, analytics reveal which funds are actively reviewing materials and which have gone quiet. This informs your negotiating position and timeline decisions.
Set appropriate access controls on your data room. Password protection, email verification, NDA requirements before access, and link expiration dates prevent unauthorized distribution of sensitive materials. Analytics tell you who is looking; access controls determine who can look.
Building Your Fundraising Analytics Stack
The practical setup is straightforward:
-
Upload your pitch deck to a document sharing platform with page-level analytics - not as an email attachment. Email attachments have zero tracking once downloaded.
-
Generate unique links per investor or per batch. Personalized links identify specific recipients. Batch links (one per outreach round) show aggregate patterns.
-
Require email verification on the sharing link. This identifies who opened the deck when you send a general link that gets forwarded.
-
Set up a tracking dashboard. Review analytics daily during active outreach. The window between an investor's first view and their decision to take a meeting is often 48-72 hours. Timely follow-up during this window makes the difference.
-
Iterate the deck based on data. After 20 sends, you have enough viewing data to identify which slides work and which do not. Redesign the weak points. The second round of outreach performs better than the first because the deck is now data-informed.
-
Transition to a data room when diligence begins. Move detailed materials into a folder-based data room with the same analytics. The investor sees a professional, organized repository. You see exactly which documents they are evaluating.
The Silence Is Data
Fundraising silence is not the absence of information. With document analytics, silence is one of several identifiable states - each with its own meaning and appropriate response.
An investor who opened your deck, spent 6 minutes, returned twice, and forwarded it to a partner is not silent - they are evaluating. An investor who never opened the email is not rejecting you - they may not have seen your outreach. An investor who opened the deck for 15 seconds and never returned has given you an answer, even without replying.
The founders who raise efficiently are the ones who read these signals and act on them. They follow up with the engaged investors. They re-approach the ones who missed the deck. They stop chasing the ones who skimmed and moved on.
The pitch deck is your first conversation with an investor. Analytics let you listen to their side of it.
PaperLink tracks page-by-page viewing analytics for shared documents - including time per page, viewer identification, completion percentage, and forwarding detection. Founders use it to share pitch decks with full engagement tracking, password protection, and NDA requirements. Data rooms are included for due diligence stage. Try it free.
If your analytics show investors opening the deck but not finishing it, the problem is in the deck itself. See Why Pitch Decks Get Opened but Not Read for how to find the slide that loses them.
For the documents investors expect after the deck, see The Data Room Checklist for Startup Fundraising.