An email open tells you almost nothing. An investor clicked the link, the deck loaded, and the tracking pixel fired. That registers as "opened" in most tools, and founders read it as interest. It usually is not.
The average investor spends roughly two to three minutes on a pitch deck (DocSend), and a large share never get that far. By one analysis of DocSend data, around 31% of investors leave within the first ten seconds, while those who make it past the third slide finish the deck about 82% of the time (Keysprung). The open is not the signal. What happens in the first fifteen seconds is.
If you share your deck as a tracked link, you can see which it was: a genuine read or a polite click. More useful still, you can see where attention died, which tells you what to fix before you send the deck to the next investor.
A Click Is Not a Read
"Opened" is a binary that hides the only distinction that matters. Two investors both show as having opened your deck. One spent eight minutes across every slide and returned the next day. The other glanced at the cover, scrolled to slide three, and closed it in twenty seconds. Email tracking calls both an open. They are not the same event.
The cost of confusing them is wasted follow-up. You send an enthusiastic "great to see you reviewed our deck" to someone who skimmed two slides, and you sound out of touch. Worse, you read the open as traction and stop refining a deck that is quietly losing every investor on slide two.
Page-level analytics separate the two. Instead of "opened," you see how long the investor stayed, how many slides they actually viewed, and where they stopped. The open becomes a story rather than a checkbox.
The Three Numbers That Reveal Real Attention
Three metrics, read together, tell you whether your deck held an investor or lost them.
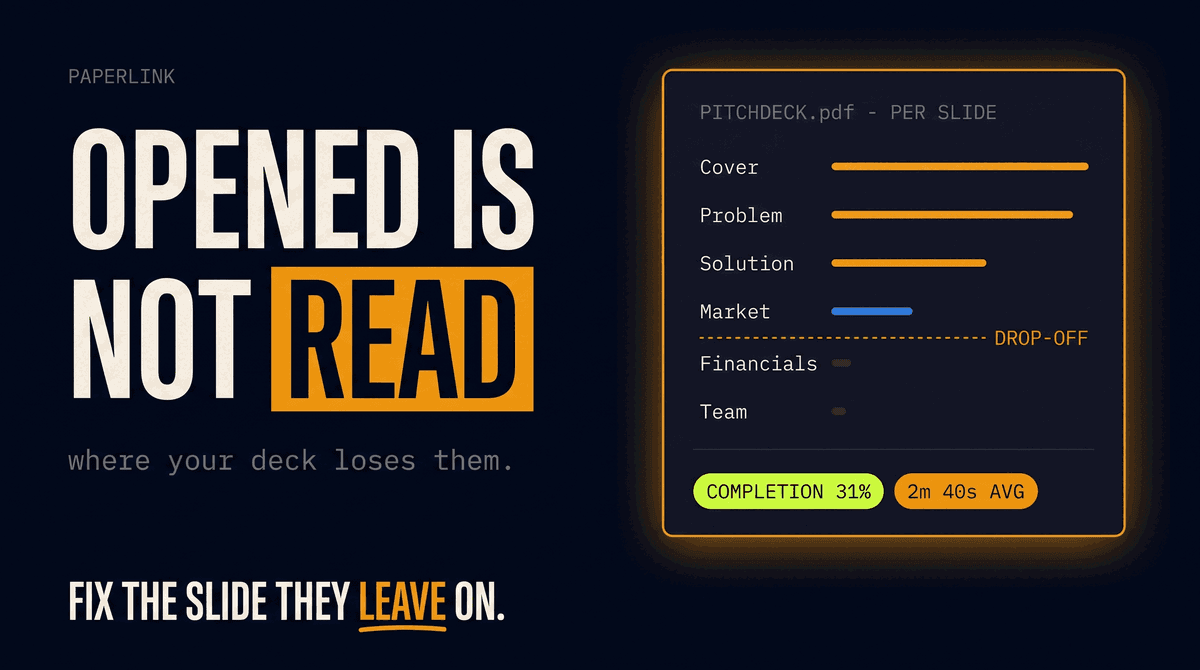
Completion rate. The percentage of slides viewed. An investor who saw three of fourteen slides did not evaluate your company. A completion rate that collapses across most viewers is not bad luck. It is a deck that stops working at a specific point.
Time per slide. The average deck gets about 21 seconds per slide of attention, and that time is not spread evenly (Keysprung). A slide that consistently gets two seconds is being skipped. A slide that gets ninety is either compelling or confusing, and the surrounding behavior tells you which.
The drop-off slide. Across all viewers, there is usually one slide where attention falls off a cliff. Everyone reads up to it, few read past it. That slide is your deck's bottleneck, and it is almost never the one founders expect.
PaperLink builds a page engagement heatmap across all viewers of a document, so you can see which slides hold attention and which get skipped. For the full set of analytics, see Track Who Viewed Your Shared Documents.
The First Three Slides Are a Filter
The data points to one structural truth: a pitch deck is not read front to back at an even pace. The opening slides are a filter that decides whether the rest gets read at all. Investors who survive the first three slides finish the deck the large majority of the time; those who do not, leave (Keysprung).
This reframes where your editing effort should go. Founders polish the financial model on slide nine and the team bios on slide eleven, then watch analytics show that almost no one reaches them. The slides that decide your raise are the cover, the problem, and the solution. If those three do not earn the next click, the rest of the deck does not exist.
If your analytics show a sharp drop after slide two or three, the problem is not your numbers. It is that the opening did not make the investor want to see your numbers. Fix the filter before you touch anything downstream.
What to Fix When Attention Dies
The drop-off point in your heatmap maps to a specific deck problem. A few common patterns:
- Drop on the cover or problem slide. The premise did not land in the first ten seconds. The problem is either unclear or feels small. This is the most expensive failure because it loses the most investors.
- Drop after the solution. The investor understood the problem but not why your solution wins. The market or differentiation slide is not doing its job.
- Long pause, then exit, on a single slide. Confusion, not interest. A slide that holds attention and then ends the session is usually overloaded or unclear, not persuasive.
- High completion but short total time. They flipped through quickly without stopping anywhere. The deck is skimmable but not gripping. Nothing earned a pause.
Each of these is a deck edit, not a follow-up tactic. The analytics turn a vague "investors are not biting" into a specific slide to rewrite.
Read the Pattern, Not the Open
The next time a tool tells you an investor opened your deck, treat it as the start of the question, not the answer. Did they read it, or did they click and leave? Where did attention concentrate, and where did it die? A deck that everyone opens and no one finishes does not have a distribution problem. It has a content problem, and the heatmap shows you exactly where.
Fix the slide that loses people, and the same deck that was getting polite clicks starts getting meetings.
Share your pitch deck as a tracked link. To turn the engagement data into a follow-up strategy, see Pitch Deck Analytics: Know Which Investors Read Your Deck. For the documents investors expect after the deck, see The Data Room Checklist for Startup Fundraising.